Kyle P. O'Brien

I am a senior undergraduate student at the University of Maryland, Baltimore County (UMBC) studying Political Science, History, and GIS.
I am reachable by e-mail at kobrien2@umbc.edu or kyleobrien1204@gmail.com and by phone at 443-900-4066.
Please feel free to contact me with any questions or comments.
Measuring the Efficacy of Government Conservation Efforts on Forest Cover and Health in Protected Areas of the Amazon Rainforest
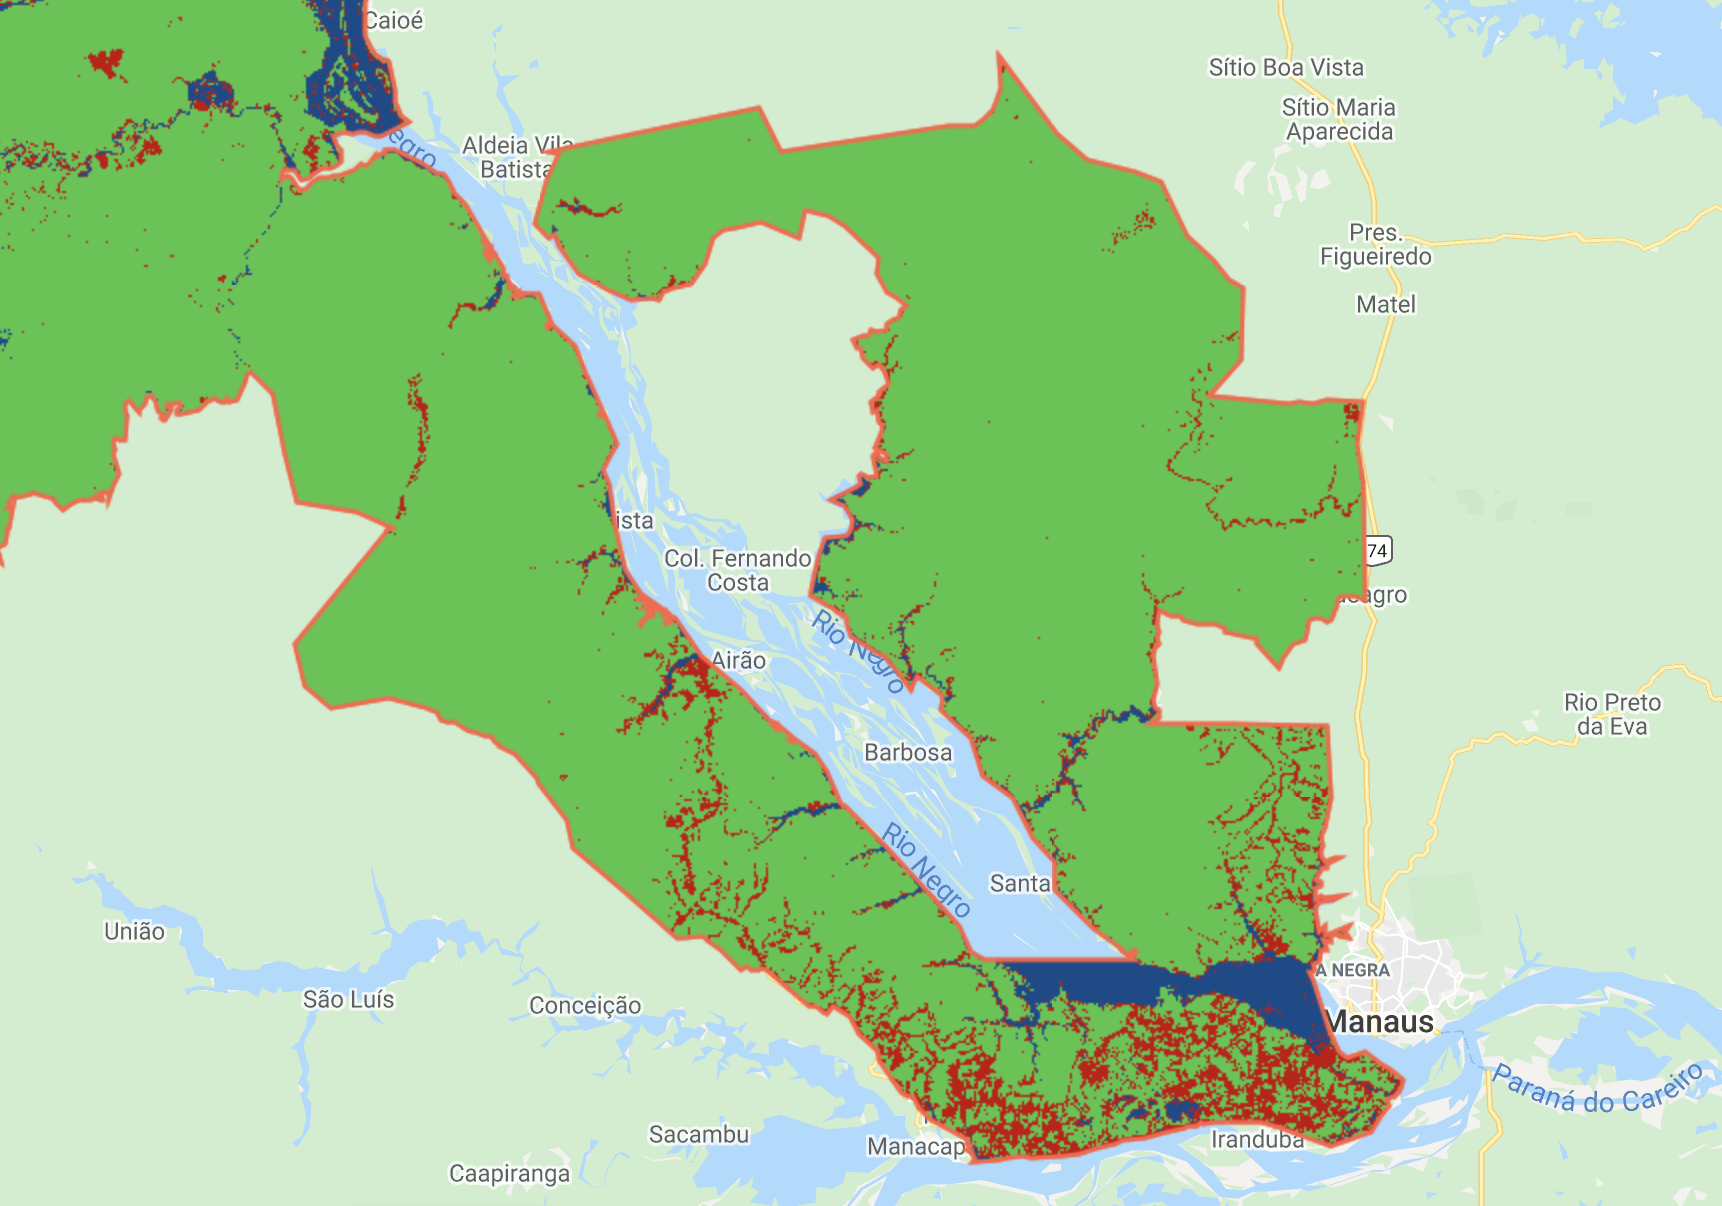
The above image is a zoomed-in look of a Landsat-derived landcover layer of the Rio Negro protected area. It highlights where deforestation has occurred due to urban spillover from the nearby city of Manaus.
Project description:
This project was a small group project that centered on a curiosity about whether the governments of Brazil, Peru, and Columbia were managing their environmental conservation efforts in the six largest protected areas of the Amazon Rainforest effectively. As part of a remote sensing course, the project utilized Google Earth Engine scripts (coded in JavaScript) to extract and process raw Landsat imagery over three decades of study from 2000 to 2010 to 2020 to look for evidence deforestation by evaluating forest health and cover to assess proper conservation. The Landsat imagery, taken from Landsats 5, 6, and 7, were put through an array of remote sensing analysis techniques. These included NDVI to assess overall vegetation health, NBR to identify burn scars that are indicative of illicit slash and burn agricultural practices, and supervised image classification to create and compare landcover maps throughout the years for evidence of forest cover change. Each team member was responsible for their own protected area and contributed various sections of the code for the final script.
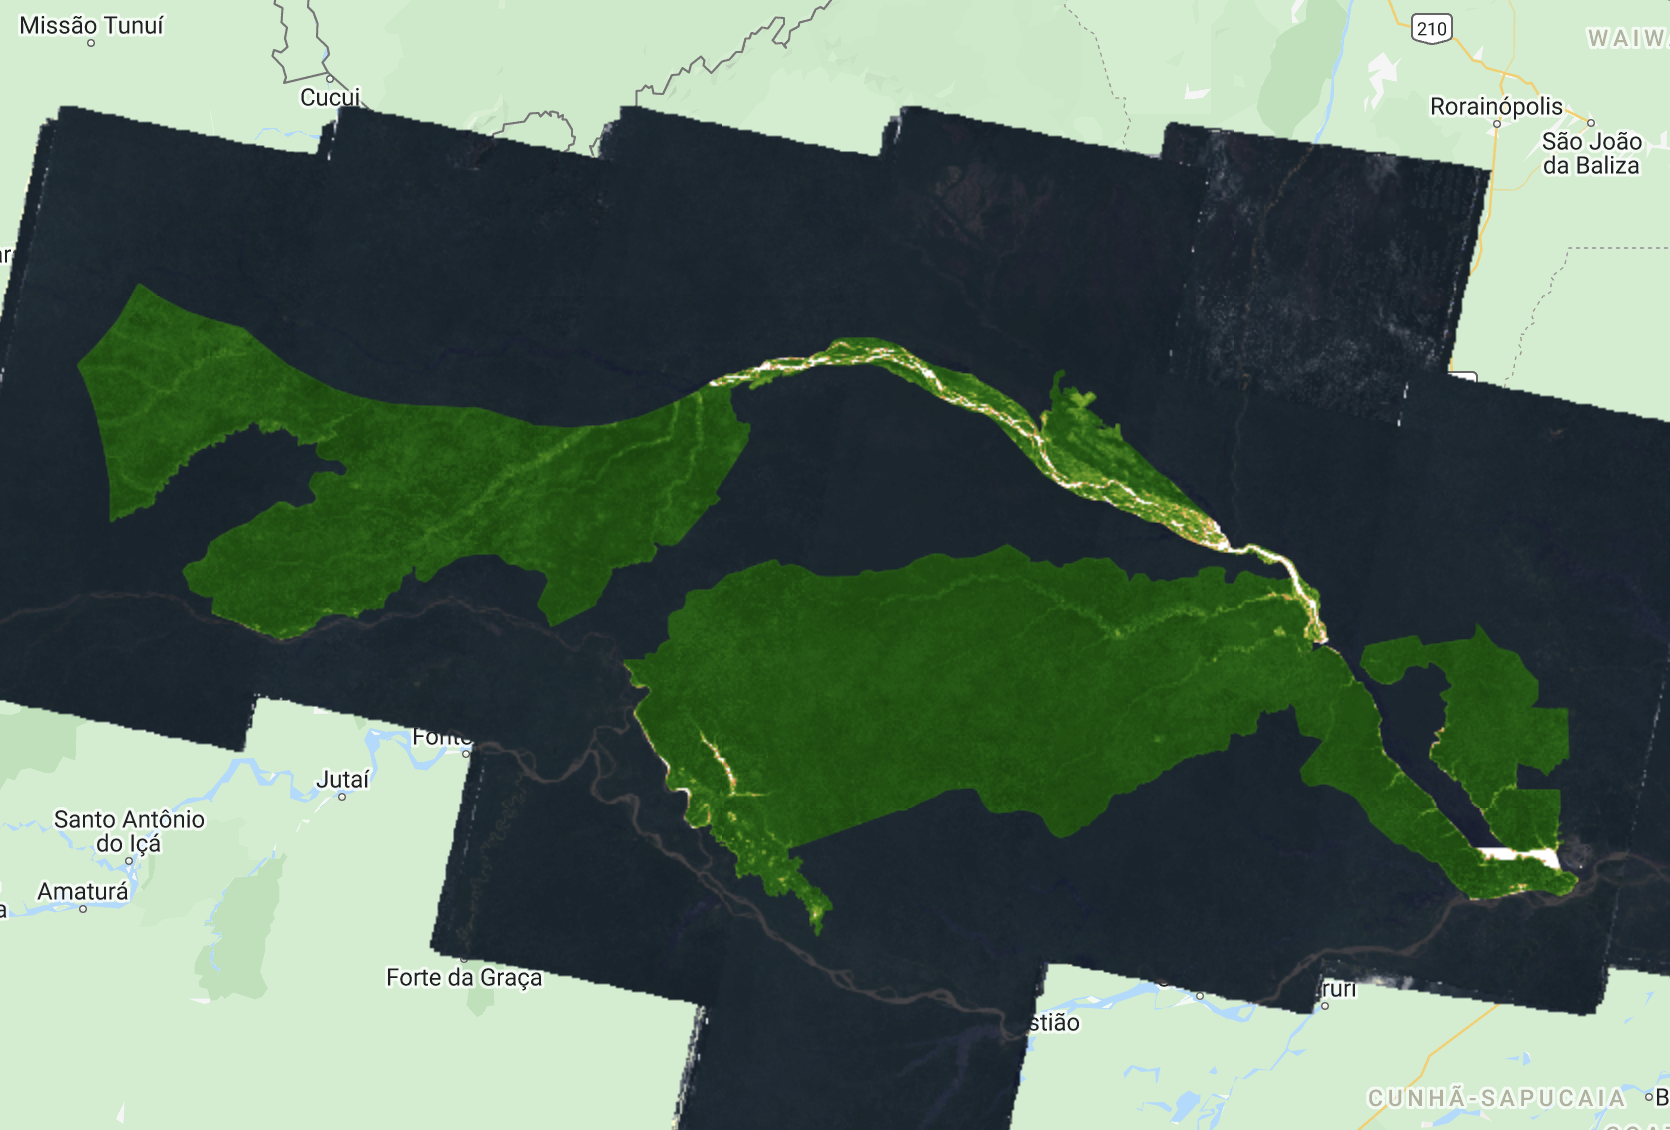
This image shows the full extent of the Rio Negro protected area, for which I was responsible, with a clipped NDVI layer that was derived from cloud-filtered and composited Landsat imagery. This area is known to be the largest conservation area in the Amazon, containing about 120,016.14 square kilometers of rainforest and rivers. Rio Negro is also designated a Wetland of International Importance and a World Heritage Site by UNESCO.
If you are interested, the key findings and results of the study can be found in the presentation below.
Link to presentation slides – https://bit.ly/3KjZbwo
The interactive final product of this project is viewable in GEE.
Link to full project in Google Earth Engine – https://bit.ly/3pcwbyF
Full Project Script:
The entire script that was used to produce the layers in our final product is included below. I am personally credited with writing the sections that provided statistical values for each of the NDVI, NBR, and Landcover layers, as well as implementing the code used to create the Landcover layers themselves. This script only demonstrates the layer creation for the area that I was responsible for studying, however, simply subsituting the area will create these layers for the new area as intended. Please note that some sections required additional processing steps to be executed in QGIS.
//  ––––  SHAPEFILE UPLOAD  ––––
// This was a collaborative project in which each team member focused on one protected area.

// Upload Rio Negro Park Shapefile
var RioNegro = ee.FeatureCollection('users/kobrien2/RioNegro');
RioNegro = RioNegro.geometry();
Map.centerObject(RioNegro,8);
Map.addLayer(RioNegro, {color: 'tomato'}, 'Rio Negro');
var ShapeAreasqkm = ('SHP area: ', RioNegro.area().divide(1000 * 1000));

//  ––––  IMAGE INPUT & CLOUD-SCREENING  ––––

// Cloud-free Composite Year 2000 Landsat 5
var surfaceReflectanceL5 = ee.ImageCollection('LANDSAT/LT05/C01/T1')
.filterDate('1999-01-01', '2001-12-31')
.filterBounds(RioNegro);
var compositeLS5 = ee.Algorithms.Landsat.simpleComposite(surfaceReflectanceL5);
Map.addLayer(compositeLS5, {bands: ['B3', 'B2', 'B1'], max: 128}, 'LS5 Composite 2000');

// Cloud-free Composite Year 2010 Landsat 7
var surfaceReflectanceL7 = ee.ImageCollection('LANDSAT/LE07/C01/T1')
.filterDate('2009-01-01', '2011-12-31')
.filterBounds(RioNegro);
var compositeLS7 = ee.Algorithms.Landsat.simpleComposite(surfaceReflectanceL7);
Map.addLayer(compositeLS7, {bands: ['B3', 'B2', 'B1'], max: 128}, 'LS7 Composite 2010');

// Cloud-free Composite Year 2020 Landsat 8
var surfaceReflectanceL8 = ee.ImageCollection('LANDSAT/LC08/C01/T1')
.filterDate('2019-01-01', '2021-12-31')
.filterBounds(RioNegro);
var compositeLS8 = ee.Algorithms.Landsat.simpleComposite(surfaceReflectanceL8);
Map.addLayer(compositeLS8, {bands: ['B4', 'B3', 'B2'], max: 128}, 'LS8 Composite 2020');

//  ––––  VEGETATION HEALTH (NDVI)  ––––

// Visualization
var ndviParams = {
  min: 0.0,
  max: 1.0,
  palette: [
    'FFFFFF', 'CE7E45', 'DF923D', 'F1B555', 'FCD163', '99B718', '74A901',
    '66A000', '529400', '3E8601', '207401', '056201', '004C00', '023B01',
    '012E01', '011D01', '011301'
  ],
};

// Landsat 5 NDVI Year 2000
var ndvi = compositeLS5.normalizedDifference(['B4', 'B3']).rename('NDVI');
var ndviClip1 = ndvi.clip(RioNegro);
Map.addLayer(ndviClip1, ndviParams, "LS5 NDVI 2000");

// Landsat 7 NDVI Year 2010
var ndvi = compositeLS7.normalizedDifference(['B4', 'B3']).rename('NDVI');
var ndviClip2 = ndvi.clip(RioNegro);
Map.addLayer(ndviClip2, ndviParams, 'LS7 NDVI 2010');

// Landsat 8 NDVI Year 2020
var ndvi = compositeLS8.normalizedDifference(['B5', 'B4']).rename('NDVI');
var ndviClip3 = ndvi.clip(RioNegro);
Map.addLayer(ndviClip3, ndviParams, 'LS8 NDVI 2020');

//  ––––  NDVI STATS  ––––

function NDVIStats (NDVI_image) {
  // Extracts NDVI Mean
  var RioNegro = ee.FeatureCollection('users/kobrien2/RioNegro');
  var meanstat = NDVI_image.reduceRegion({
    reducer: ee.Reducer.mean(),
    geometry: RioNegro,
    scale: 500,
    maxPixels: 1e13,
  });

  // Calculates Mean Value
  var ndvilist = meanstat.values();
  var ndviobject = ndvilist.get(0);
  var meanndvi = ee.Number(ndviobject);
  print('Mean NDVI = ', meanndvi)
}

//NDVI Inputs
NDVIStats(ndviClip1)
NDVIStats(ndviClip2)
NDVIStats(ndviClip3)

//  ––––  BURN INDEX (NBR)  ––––

// Visualization
var nbrParams = {
  min: 0.0,
  max: 1.0,
  palette: [
    '000000', 'FFFFFF'
  ],
};

// Landsat 5 NBR Year 2000
var NBR1 = compositeLS5.normalizedDifference(['B4', 'B7']).rename('NBR');
var NBR1Clip = NBR1.clip(RioNegro);
Map.addLayer(NBR1Clip, nbrParams, 'LS5 NBR 2000');

// Landsat 7 NBR Year 2010
var NBR2 = compositeLS7.normalizedDifference(['B4', 'B7']).rename('NBR');
var NBR2Clip = NBR2.clip(RioNegro);
Map.addLayer(NBR2Clip, nbrParams, 'LS7 NBR 2010');

// Landsat 8 NBR Year 2020
var NBR3 = compositeLS8.normalizedDifference(['B5', 'B7']).rename('NBR');
var NBR3Clip = NBR3.clip(RioNegro);
Map.addLayer(NBR3Clip, nbrParams, 'LS8 NBR 2020');

//  ––––  NBR STATS  ––––

function NBRStats (NBR_image) {
  // Extracts NBR Mean
  var RioNegro = ee.FeatureCollection('users/kobrien2/RioNegro');
  var meanstat = NBR_image.reduceRegion({
    reducer: ee.Reducer.mean(),
    geometry: RioNegro,
    scale: 500,
    maxPixels: 1e13,
  });

  // Calculates Mean Value
  var nbrlist = meanstat.values();
  var nbrobject = nbrlist.get(0);
  var meannbr = ee.Number(nbrobject);
  print('Mean NBR = ', meannbr)
}

// NBR Inputs
NBRStats(NBR1Clip)
NBRStats(NBR2Clip)
NBRStats(NBR3Clip)

//  ––––   CLASSIFICATION & LANDCOVER   ––––
// This section requires manual image classification training data to be created in the form of polygons. These were
// then exported into GQIS to be converted into point samples within the polygons to cut down on processing requirements.

// Training Data (w/ Export to QGIS and Reuploaded Points)
Export.table.toDrive({
  collection: Forest,
  description:'forestfcToDrive',
  fileFormat: 'SHP'
});

Export.table.toDrive({
  collection: NotForest,
  description:'notforestfcToDrive',
  fileFormat: 'SHP'
});

Export.table.toDrive({
  collection: Water,
  description:'waterfcToDrive',
  fileFormat: 'SHP'
});

var newfc = forest.merge(notforest).merge(water);


// Landsat 5 Landcover Year 2000
var bands = ['B2', 'B3', 'B4', 'B5'];
var points = compositeLS5.select(bands).sampleRegions({
  collection: newfc,
  properties: ['landcover'],
  scale: 30
}).randomColumn();

var classifier = ee.Classifier.smileCart().train({
  features: points,
  classProperty: 'landcover',
  inputProperties: bands
});

var classified = compositeLS5.select(bands).classify(classifier);
var Landcover2000 = classified.clip(RioNegro);
Map.addLayer(Landcover2000, {min: 0, max: 2, palette: ['44c645', '#c60000', '0b4a8b']}, 'LS5 Landcover 2000');


// Landsat 7 Landcover Year 2010
bands = ['B2', 'B3', 'B4', 'B5'];
points = compositeLS7.select(bands).sampleRegions({
  collection: newfc,
  properties: ['landcover'],
  scale: 30
}).randomColumn();

classifier = ee.Classifier.smileCart().train({
  features: points,
  classProperty: 'landcover',
  inputProperties: bands
});

classified = compositeLS7.select(bands).classify(classifier);
var Landcover2010 = classified.clip(RioNegro);
Map.addLayer(Landcover2010, {min: 0, max: 2, palette: ['44c645', '#c60000', '0b4a8b']}, 'LS7 Landcover 2010');


// Landsat 8 Landcover Year 2020
bands = ['B3', 'B4', 'B5', 'B6', 'B7'];
points = compositeLS8.select(bands).sampleRegions({
  collection: newfc,
  properties: ['landcover'],
  scale: 30
}).randomColumn();

classifier = ee.Classifier.smileCart().train({
  features: points,
  classProperty: 'landcover',
  inputProperties: bands
});

classified = compositeLS8.select(bands).classify(classifier);
var Landcover2020 = classified.clip(RioNegro);
Map.addLayer(Landcover2020, {min: 0, max: 2, palette: ['44c645', '#c60000', '0b4a8b']}, 'LS8 Landcover 2020');

//  ––––  CLASS STATISTICS  ––––

function ClassStats (class_image, class_type){
  // Extracts Class Area
  var landclass = class_image.select('classification').eq(class_type);
  var area = landclass.multiply(ee.Image.pixelArea()).divide(1e6);
  var RioNegro = ee.FeatureCollection('users/kobrien2/RioNegro');
  var stat = area.reduceRegion ({
  reducer: ee.Reducer.sum(),
  geometry: RioNegro,
  scale: 500,
  maxPixels: 1e13,
    });

  // Calculates Area Percentage
  var statval = stat.values();
  var statnum = statval.get(0);
  var statfloat = ee.Number(statnum);
  var percentage = statfloat.divide(ShapeAreasqkm);
  print('Class % = ', percentage);
}

//Stat Inputs (Classes: 0 = Forest, 1 = NotForest, 2 = Water)
ClassStats(Landcover2000, 0);
ClassStats(Landcover2010, 0);
ClassStats(Landcover2020, 0);
ClassStats(Landcover2000, 1);
ClassStats(Landcover2010, 1);
ClassStats(Landcover2020, 1);
ClassStats(Landcover2000, 2);
ClassStats(Landcover2010, 2);
ClassStats(Landcover2020, 2);

//  ––––  ACCURACY ASSESSMENT  ––––
// This section required 'ground truth' point samples for each landcover class based on google's
// satellite map and export to QGIS to compare these points to the landcover layer to report accuracy.
// The results of these accuracy assessments were then compiled into data tables for the presentation.

var newfc2 = ForestAcc.merge(NotForestAcc).merge(WaterAcc);

// Export the FeatureCollection
Export.table.toDrive({
  collection: newfc2,
  description:'AccuracyPoints',
  fileFormat: 'SHP'
});

var geometry = RioNegro.geometry;
Export.image.toDrive({
  image: Landcover2020,
  description: 'LCmap2020',
  scale: 30,
  region: geometry,
  maxPixels: 1e12
});

//  ––––  PROTECTED AREA OUTLINE  ––––

var RioNegro = ee.FeatureCollection('users/kobrien2/RioNegro');
var outline = {color: 'tomato', fillColor: '00000000'};
var RioNegroOutline = RioNegro.style(outline);
Map.addLayer(RioNegroOutline, outline, 'Protected Area');