Kyle P. O'Brien

I am a senior undergraduate student at the University of Maryland, Baltimore County (UMBC) studying Political Science, History, and GIS.
I am reachable by e-mail at kobrien2@umbc.edu or kyleobrien1204@gmail.com and by phone at 443-900-4066.
Please feel free to contact me with any questions or comments.
GIS Portfolio
Advanced GIS
Mapping and Predicting Gentrification in Washington D.C. from 2010 to 2019
A multi-map time-series project that analyzes several indicators of gentrification and predicts the risk of gentrification across census tracts in Washington D.C. created in RStudio and QGIS with variables from the US Census Bureau obtained using tidycensus.

Motor Vehicle Fatality Rates in the U.S. from 1980 to 2020 (GIF)
A mapped time-series of vehicle accident death rates across the United States by state since 1980 visualized as animated GIF with maps produced in RStudio using data sourced from NHTSA FARS reports and US Census Bureau Decennial surveys.
Thematic & Statistical Cartography
Ukraine
Terrain Map of Ukraine
A simple elevation terrain map of Ukraine created with QGIS using several elevation DEM tiles sourced from USGS Earth Explorer.
Political Map of the Russia-Ukraine Crisis
A simple political map created in QGIS and Inkscape that showcases the fragile geopolitical balance preserved between Russia, Ukraine, and NATO just days before the Russian invasion began.

Maryland
Election Analysis: Who Should Lead the GOP?
A poster and multi-map time-series analysis of Donald Trump and Larry Hogan’s election perfomance in Maryland’s previous Presidential and Gubernatorial elections created in QGIS and Inkscape.

Baltimore City Crime Rates
Two simple and quickly-produced maps of crime rates in Baltimore City created with QGIS using data sourced from the Baltimore Neighborhood Indicators Alliance (BNIA) and the Maryland GIS Data Catalog.

Washington D.C.
Washington D.C. Chronic Inequality Spotlight
A poster and series of maps highlighting the central characteristics and indicators of inequality along census tracts in Washington D.C. created in QGIS and Inkscape using data downloaded from the U.S. Census Bureau API with tidycensus in RStudio.
Washington D.C. Racial Dot-Density
A compound dot-density map depicting population density and distribution of the three largest racial groups (excluding hispanic or latino origin) in Washington D.C. created in QGIS and using 2020 data sourced from the U.S. Census Bureau and Open Data DC.
Remote Sensing
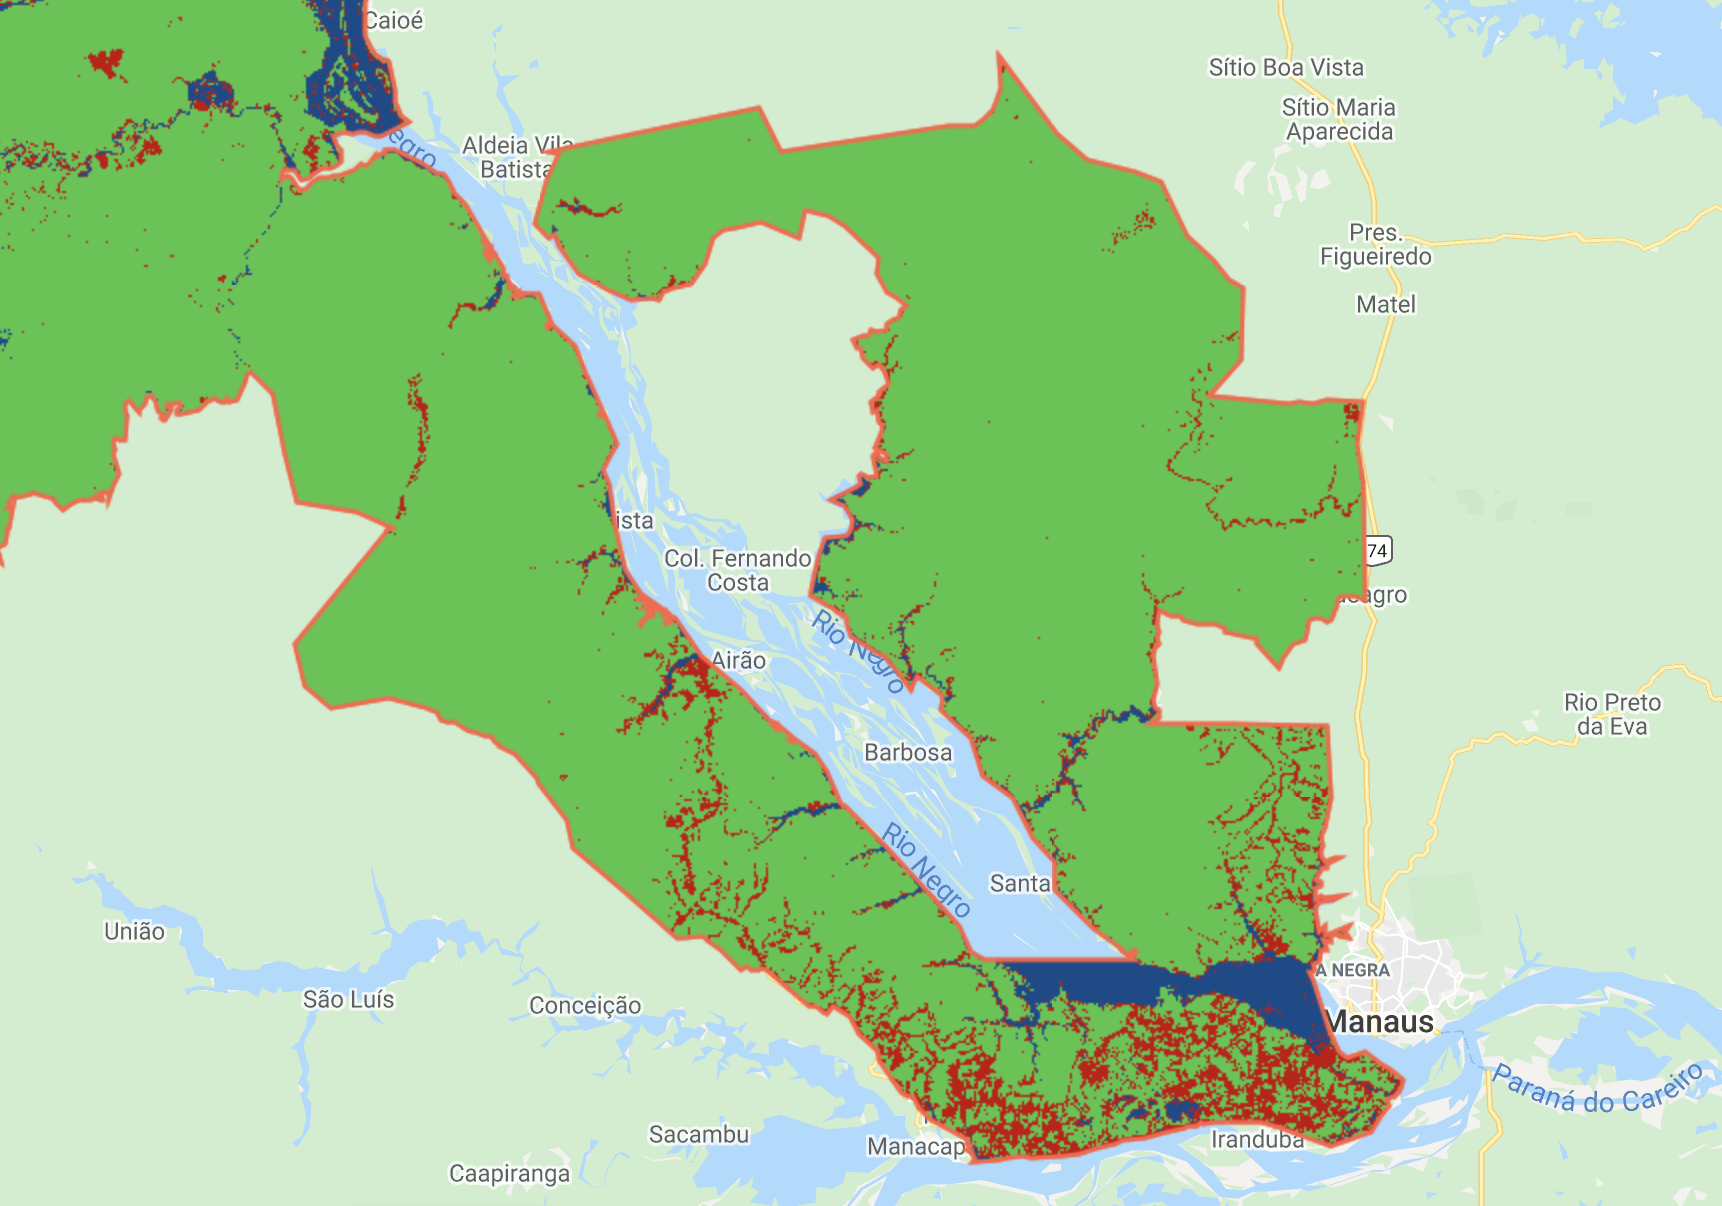
Amazon Rainforest Environmental Protection Study
A satellite imagery study of government accountability with conservation efforts in the largest protected areas within the Amazon Rainforest using Google Earth Engine.
Thank you for viewing my portfolio!